
CMX Dashboard
Client
CVS Health | CVS Media Exchange Performance Dashboard
CVS Health | CVS Media Exchange Performance Dashboard
Background
In 2021 CVS setup a new department, The Business Intelligence Center of Excellence (BICOE) and hired me on as one of their first data visualization designers to help them improve their BI reporting/analytics dashboards and digital products. Fundamentally, they wanted to enable deeper insights and promote better data driven decision making.
This was the case with the CMX (CVS Media Exchange) Dashboard. CMX is a data-led, technology-driven retail media network that enables external marketing partners to reach CVS Pharmacy customers and CVS loyalty ExtraCare card customers through a variety of digital platforms, including social channels, programmatic display and on CVS.com.
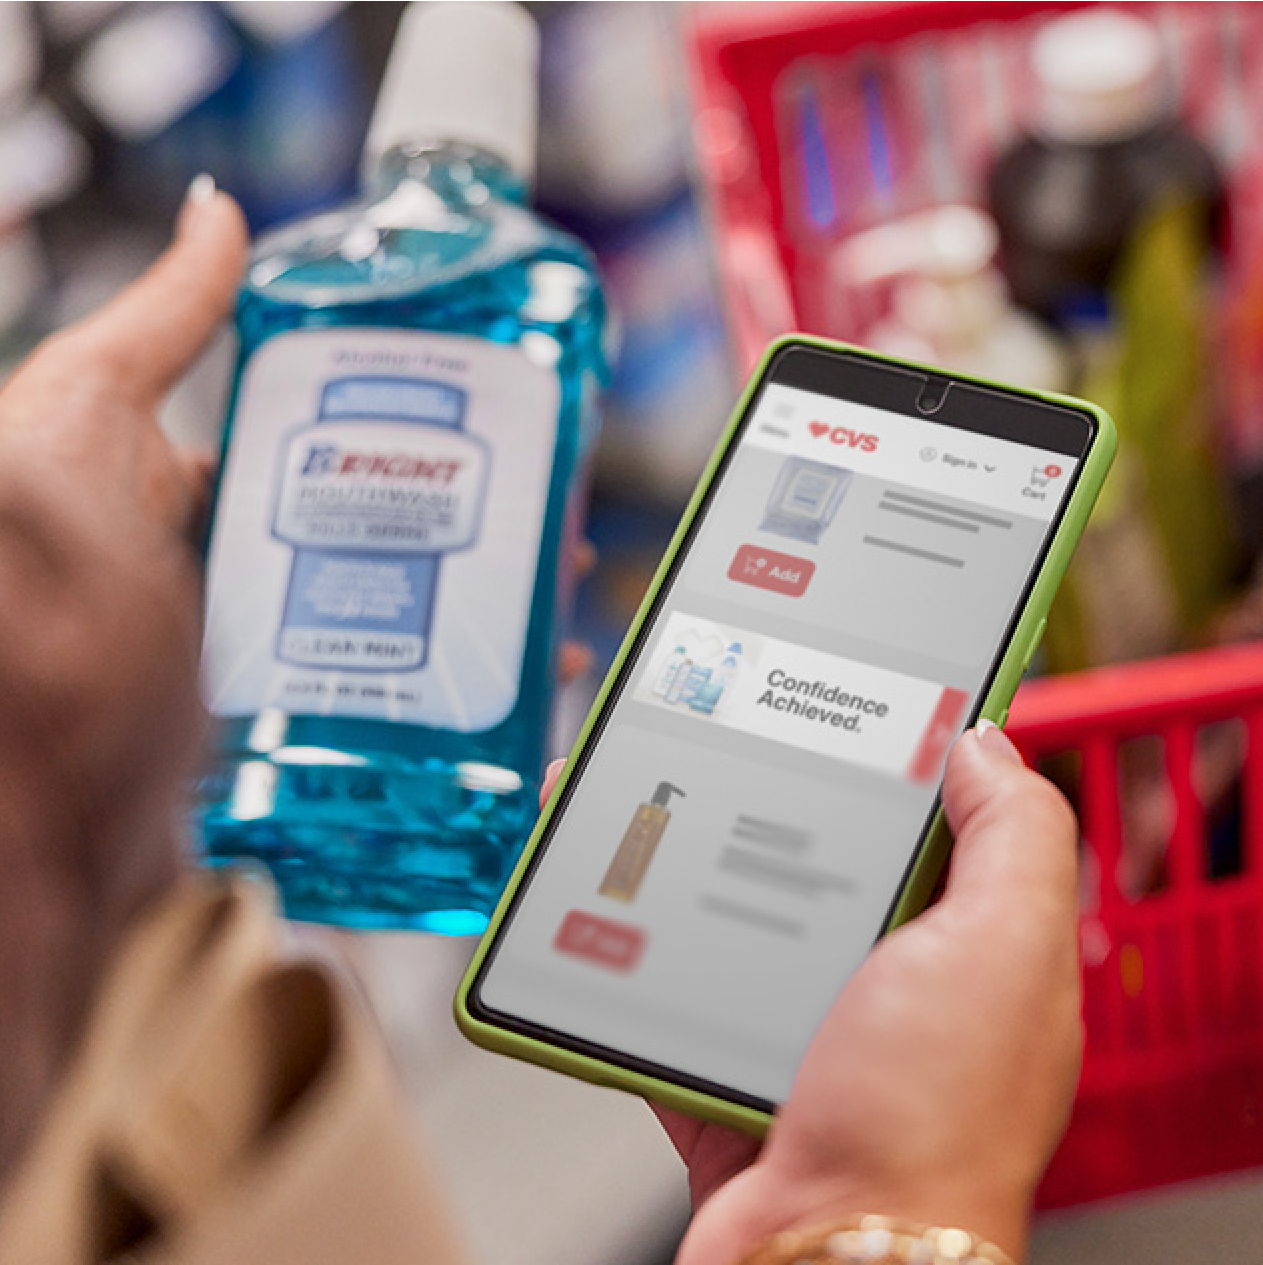
Put simply, CVS provides these brands with insights through a dashboard and helps them develop an omni-channel marketing strategy. This service is extremely attractive to large retail brands as:
85% of all American homes are within ten miles of a CVS Pharmacy store.
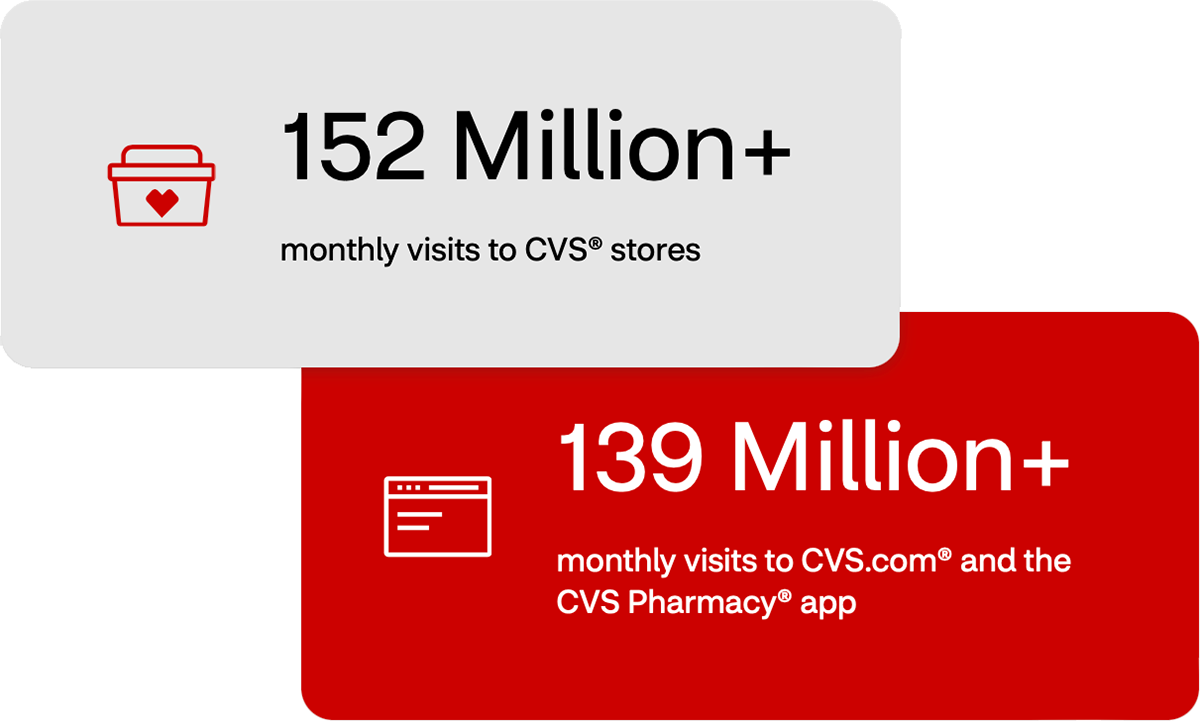
139MM+ Monthly visits to CVS.com and the CVS Pharmacy app.
152MM+ Monthly visits to CVS Pharmacy.
139MM+ Monthly visits to CVS.com and the CVS Pharmacy app.
152MM+ Monthly visits to CVS Pharmacy.
That said, CMX had an existing dashboard product that had fallen fall behind the competition regarding the metrics it displayed and functionality that it provided to the user.
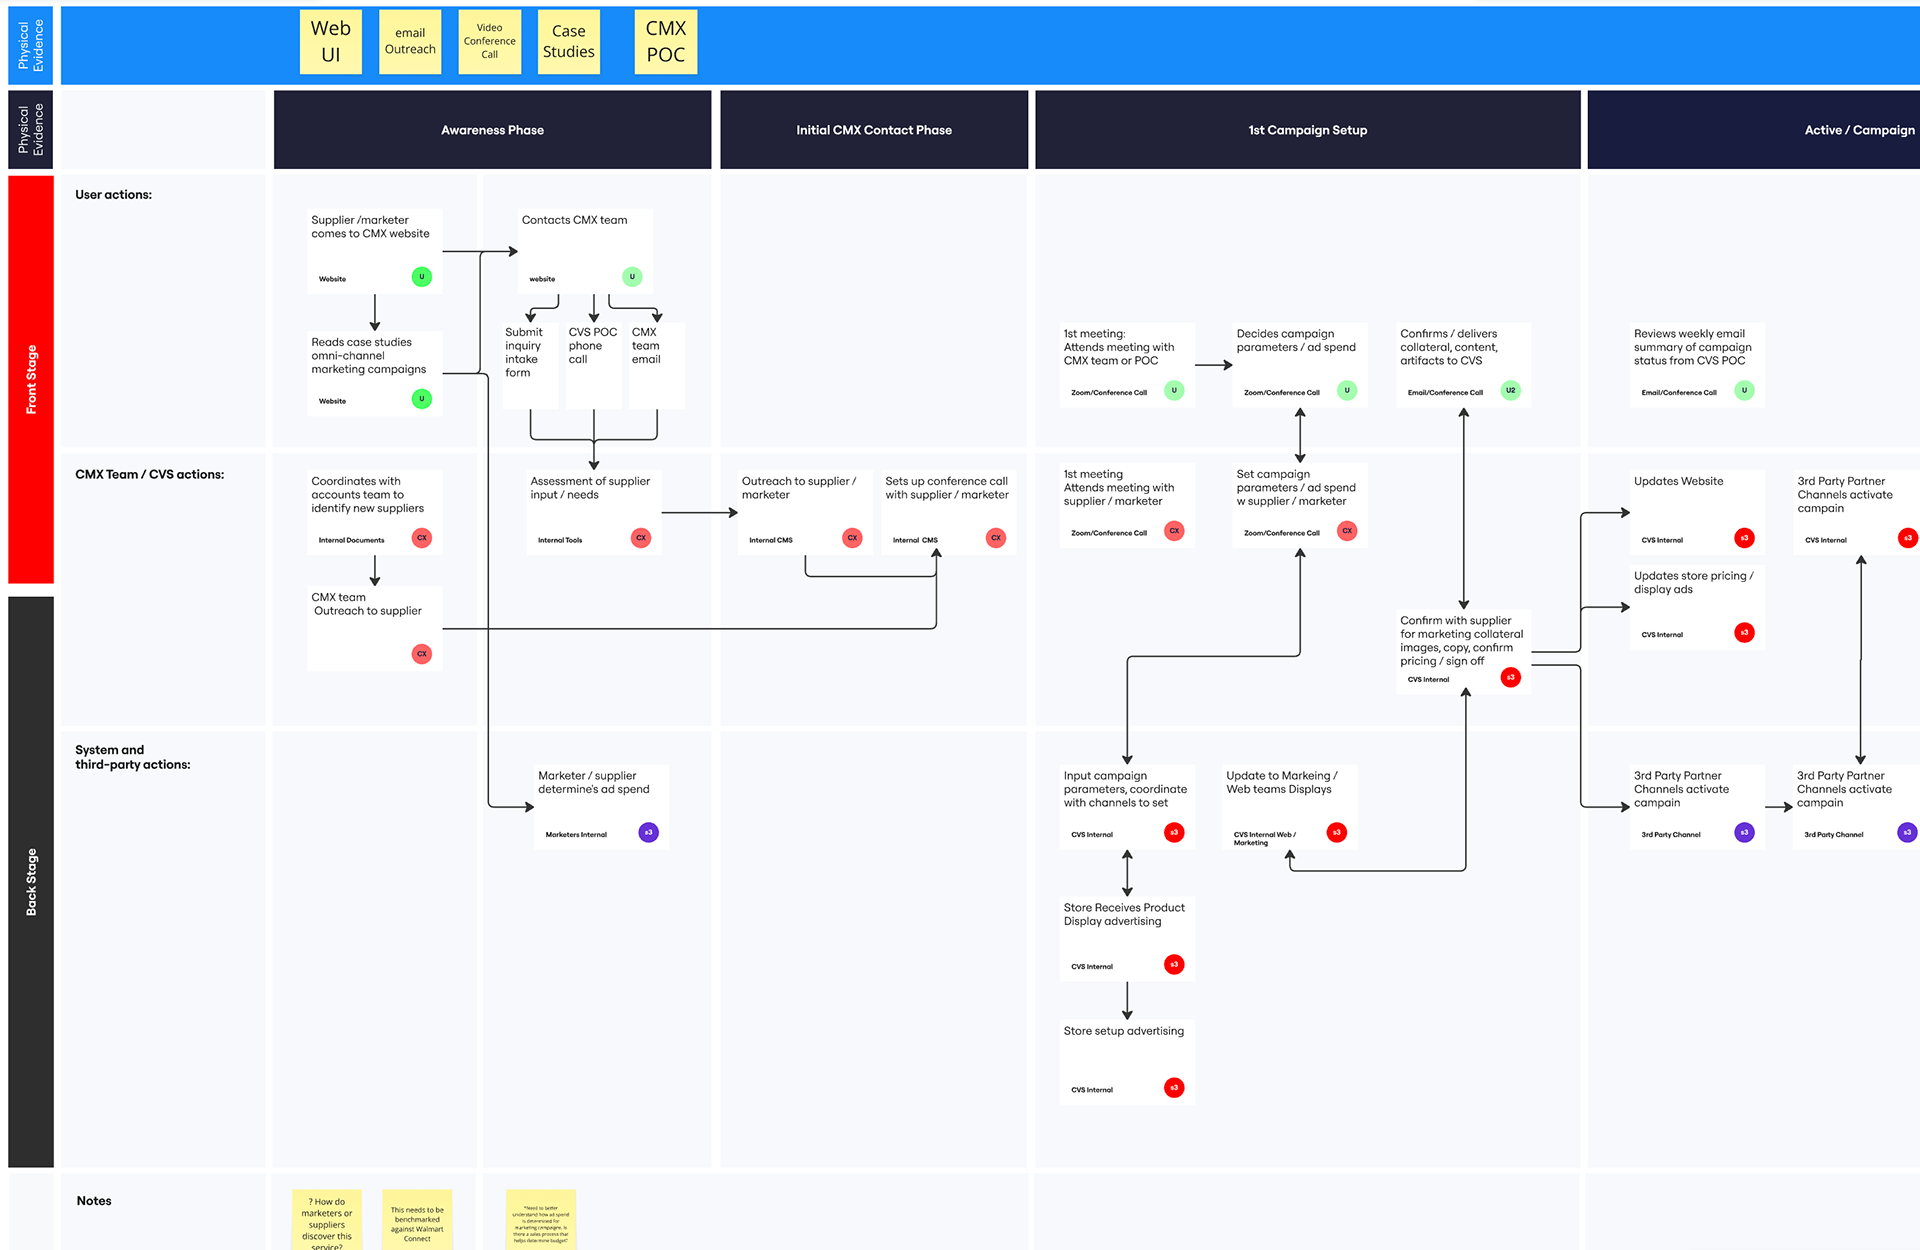
Service Blueprint and Journey Map
Kickoff: At the time of product kickoff, the CMX team shared their vision for a future state dashboard that could compete with rivals like Walmart Connect. We discussed features, what was in scope vs out of scope. When new metric data would become available, and general requirements. Although an existing CMX dashboard was already in use, user research was challenging. Not only did I lack direct access to users, or analytical tools that tracked their product usage, but I also had to rely solely on stakeholders and the CMX team to provide the voice of the customer.
I convinced the team that a journey map would help us all to better understand the customer experience from end to end, while a service blueprint would be useful in understanding surface to core how the CMX team is supporting that experience from the backstage and behind the scenes.
Design Process
User Research: After I began to map the user journey, (including actions and points of pain) explore the existing dashboard (UI, Navigation, and content), and document the way each metric was used by the clients to inform their marketing campaigns.
Content Mapping: As several data for the new metrics and features were not yet available to us, there was a great deal of ambiguity around what the UI and functionality of the dashboard would entail. As a result, after mapping the proposed content buckets and UI of each page, the team was remained uncertain if we were solving for the right user needs. That said content mapping helped us to have a relational content discussion and helped inform our wireframe designs.
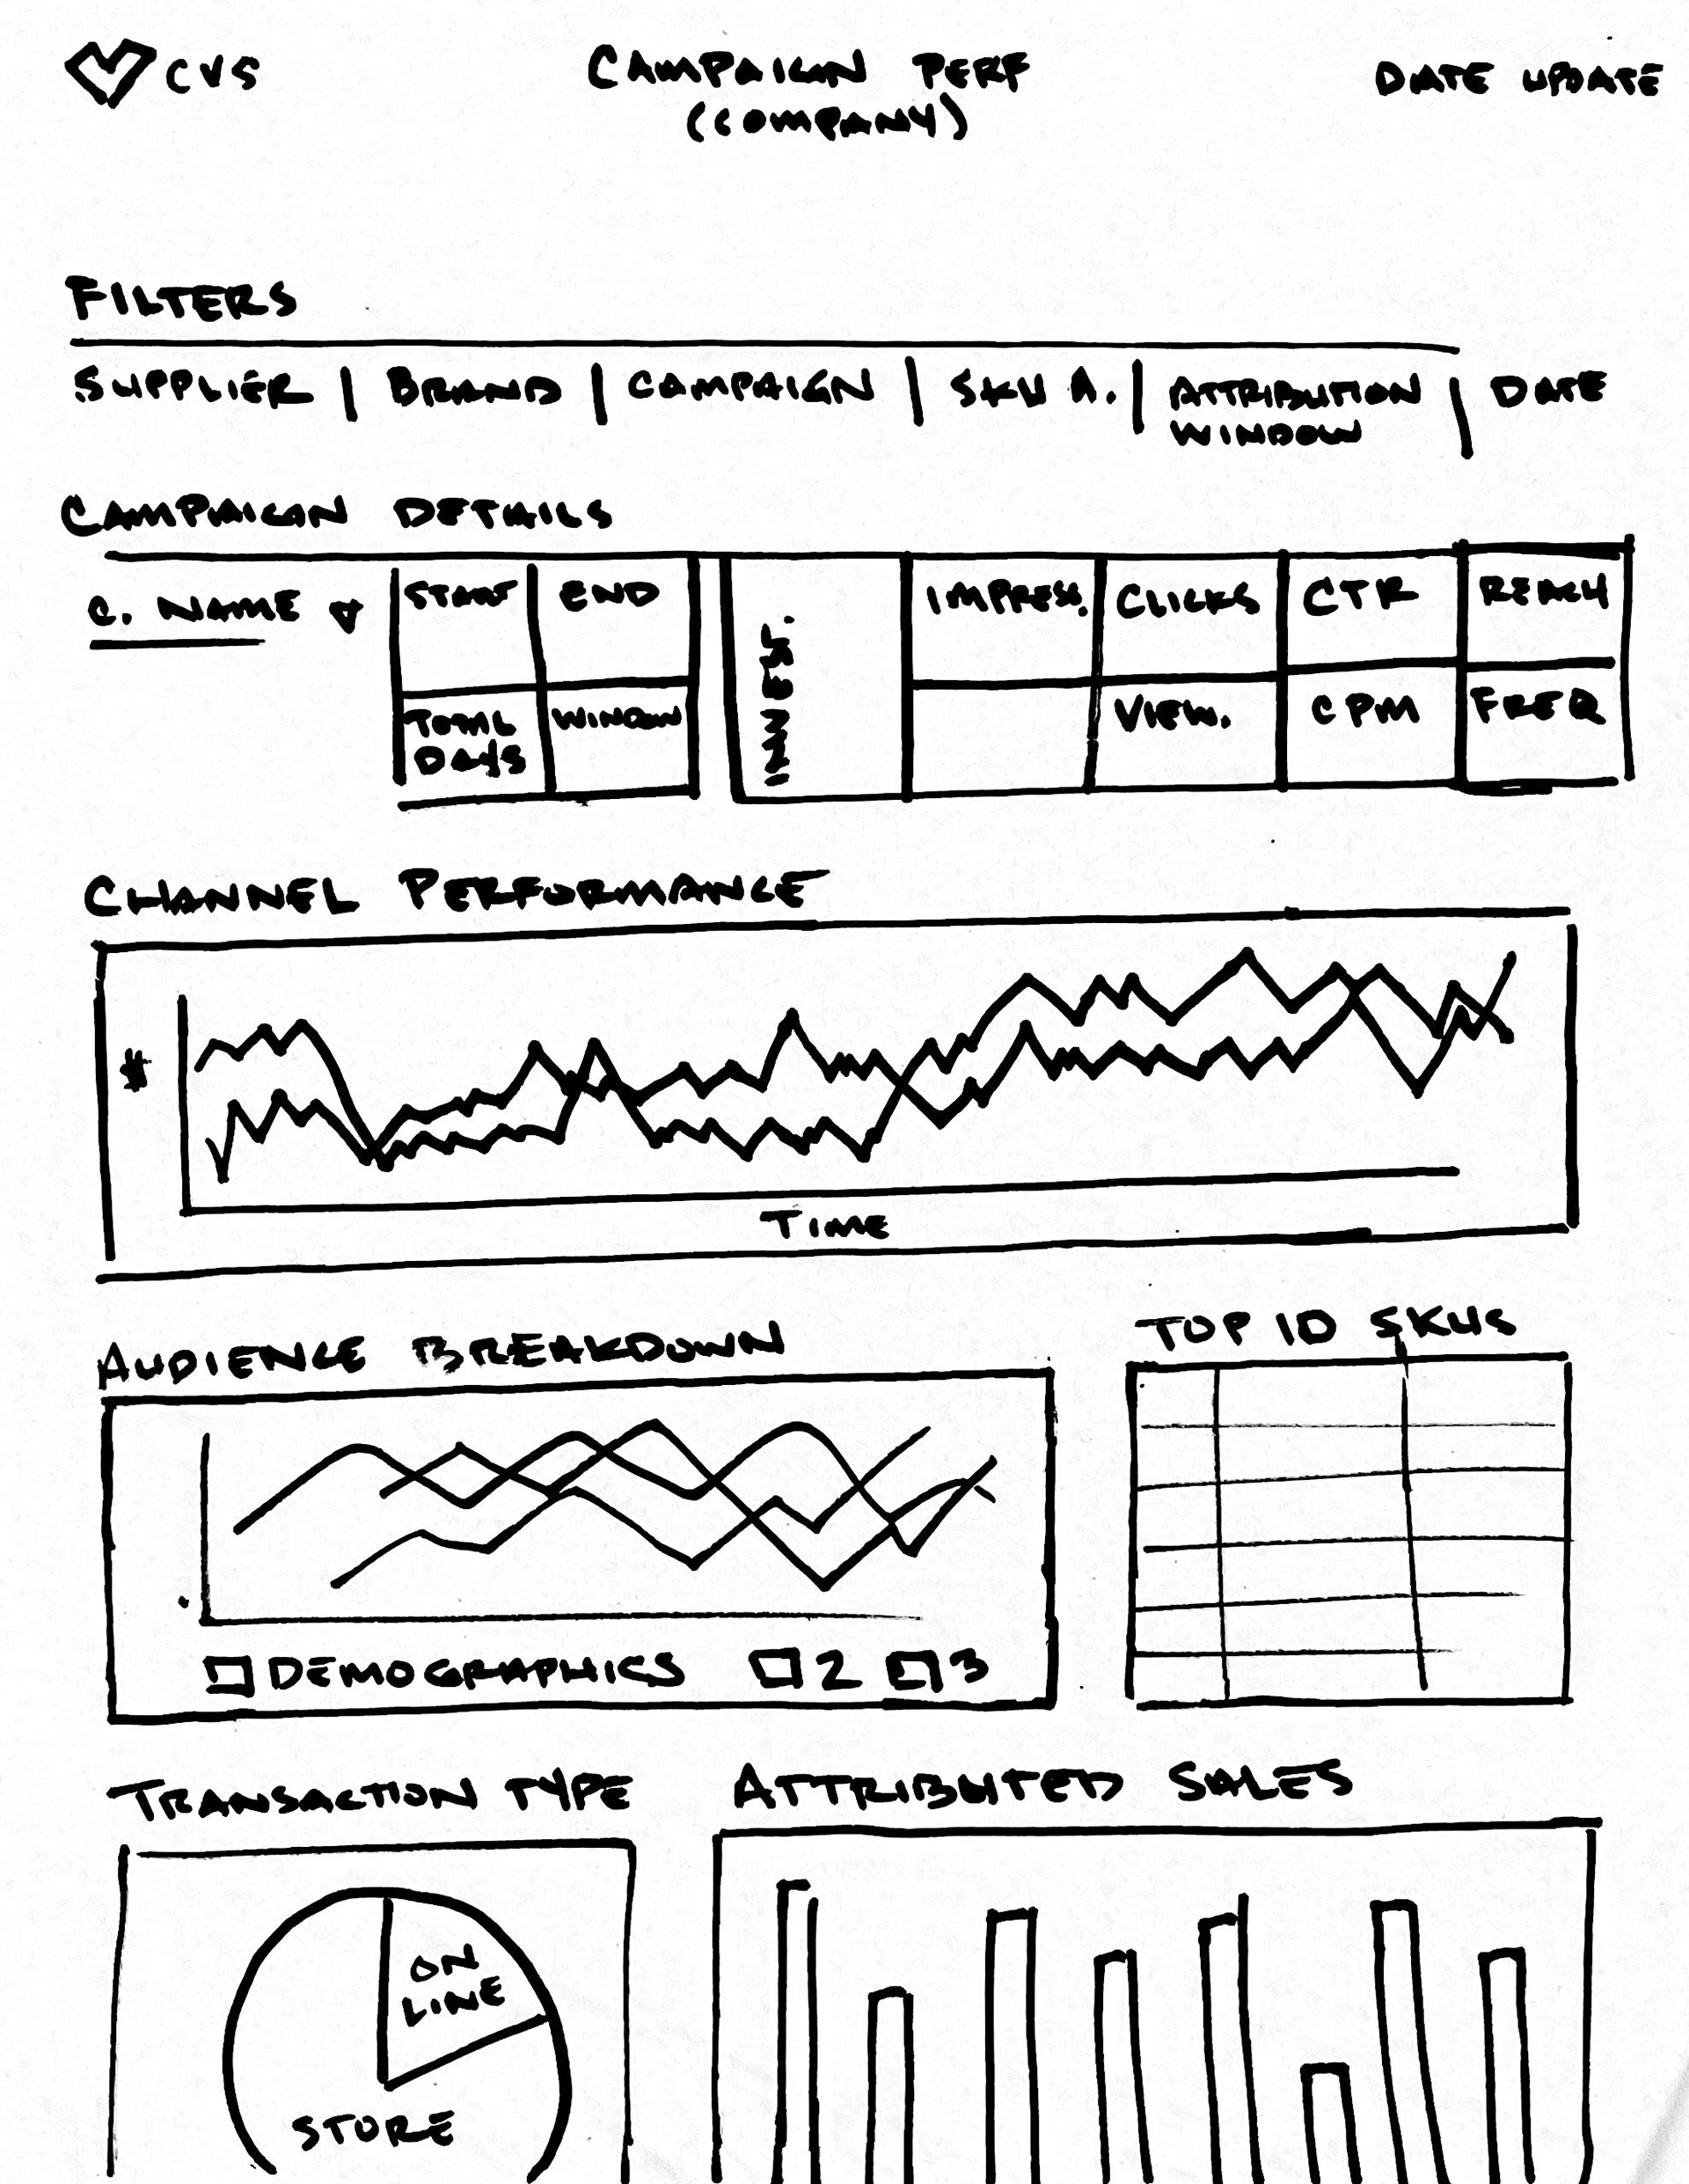
Wire Framing: I follow best practices with keeping wireframes low-fi to keep the focus on content and function. This approach helped us navigate multiple iterations and feedback from our design working sessions.
Deign Sessions: I worked in lockstep throughout the process with the developers to ensure technical feasibility and to be inclusive of developer perspective. The larger working team (PM, CMX team, and other stakeholders also actively participated leaving design feedback directly in Figma and when working asynchronously.
Client Review: This process helped us to evolve the design over several weeks and arrive at a lo-fi design that everyone could get behind.
High Fidelity Design: Further refinement happened in this phase with additional changes to some of the layout. The CMX team requested net new screens to solve for newly surfaced CMX internal user requirements and specific external user types.
Prior to development handoff, we learned that some of the data (including top line metrics we were dependent on for this design would not be available in time for launch, which caused additional modifications to the design to be made out of necessity.
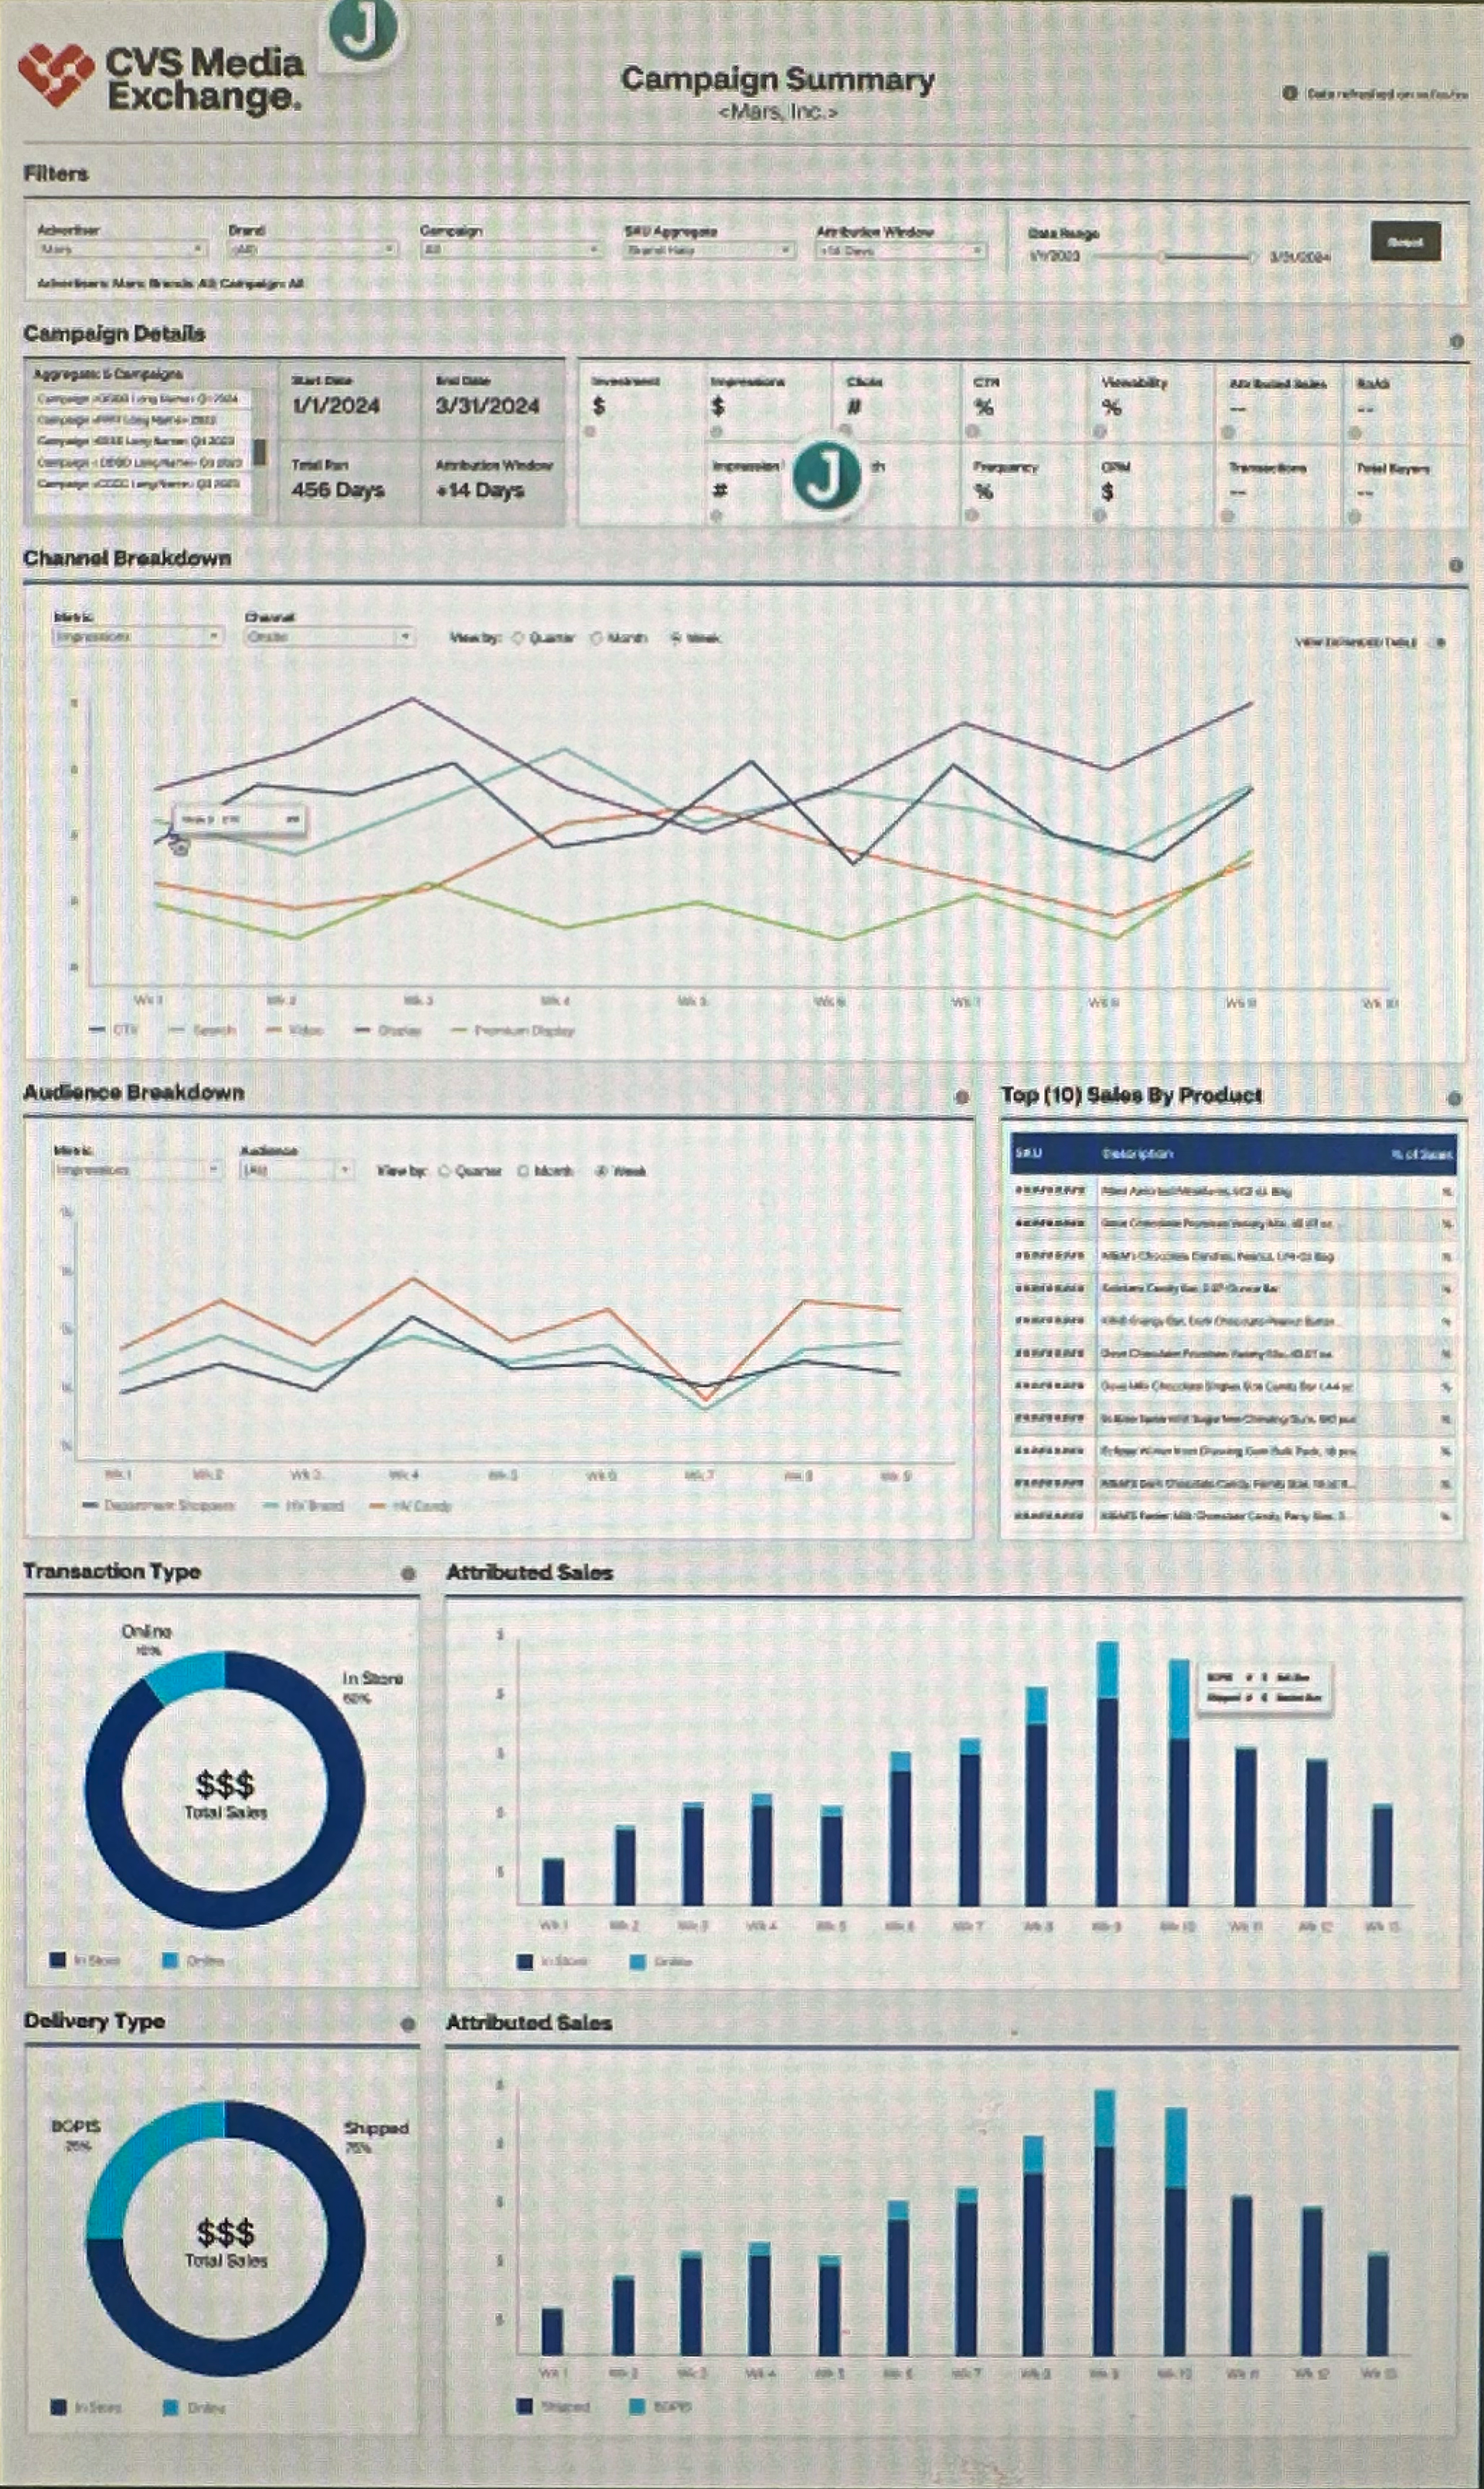
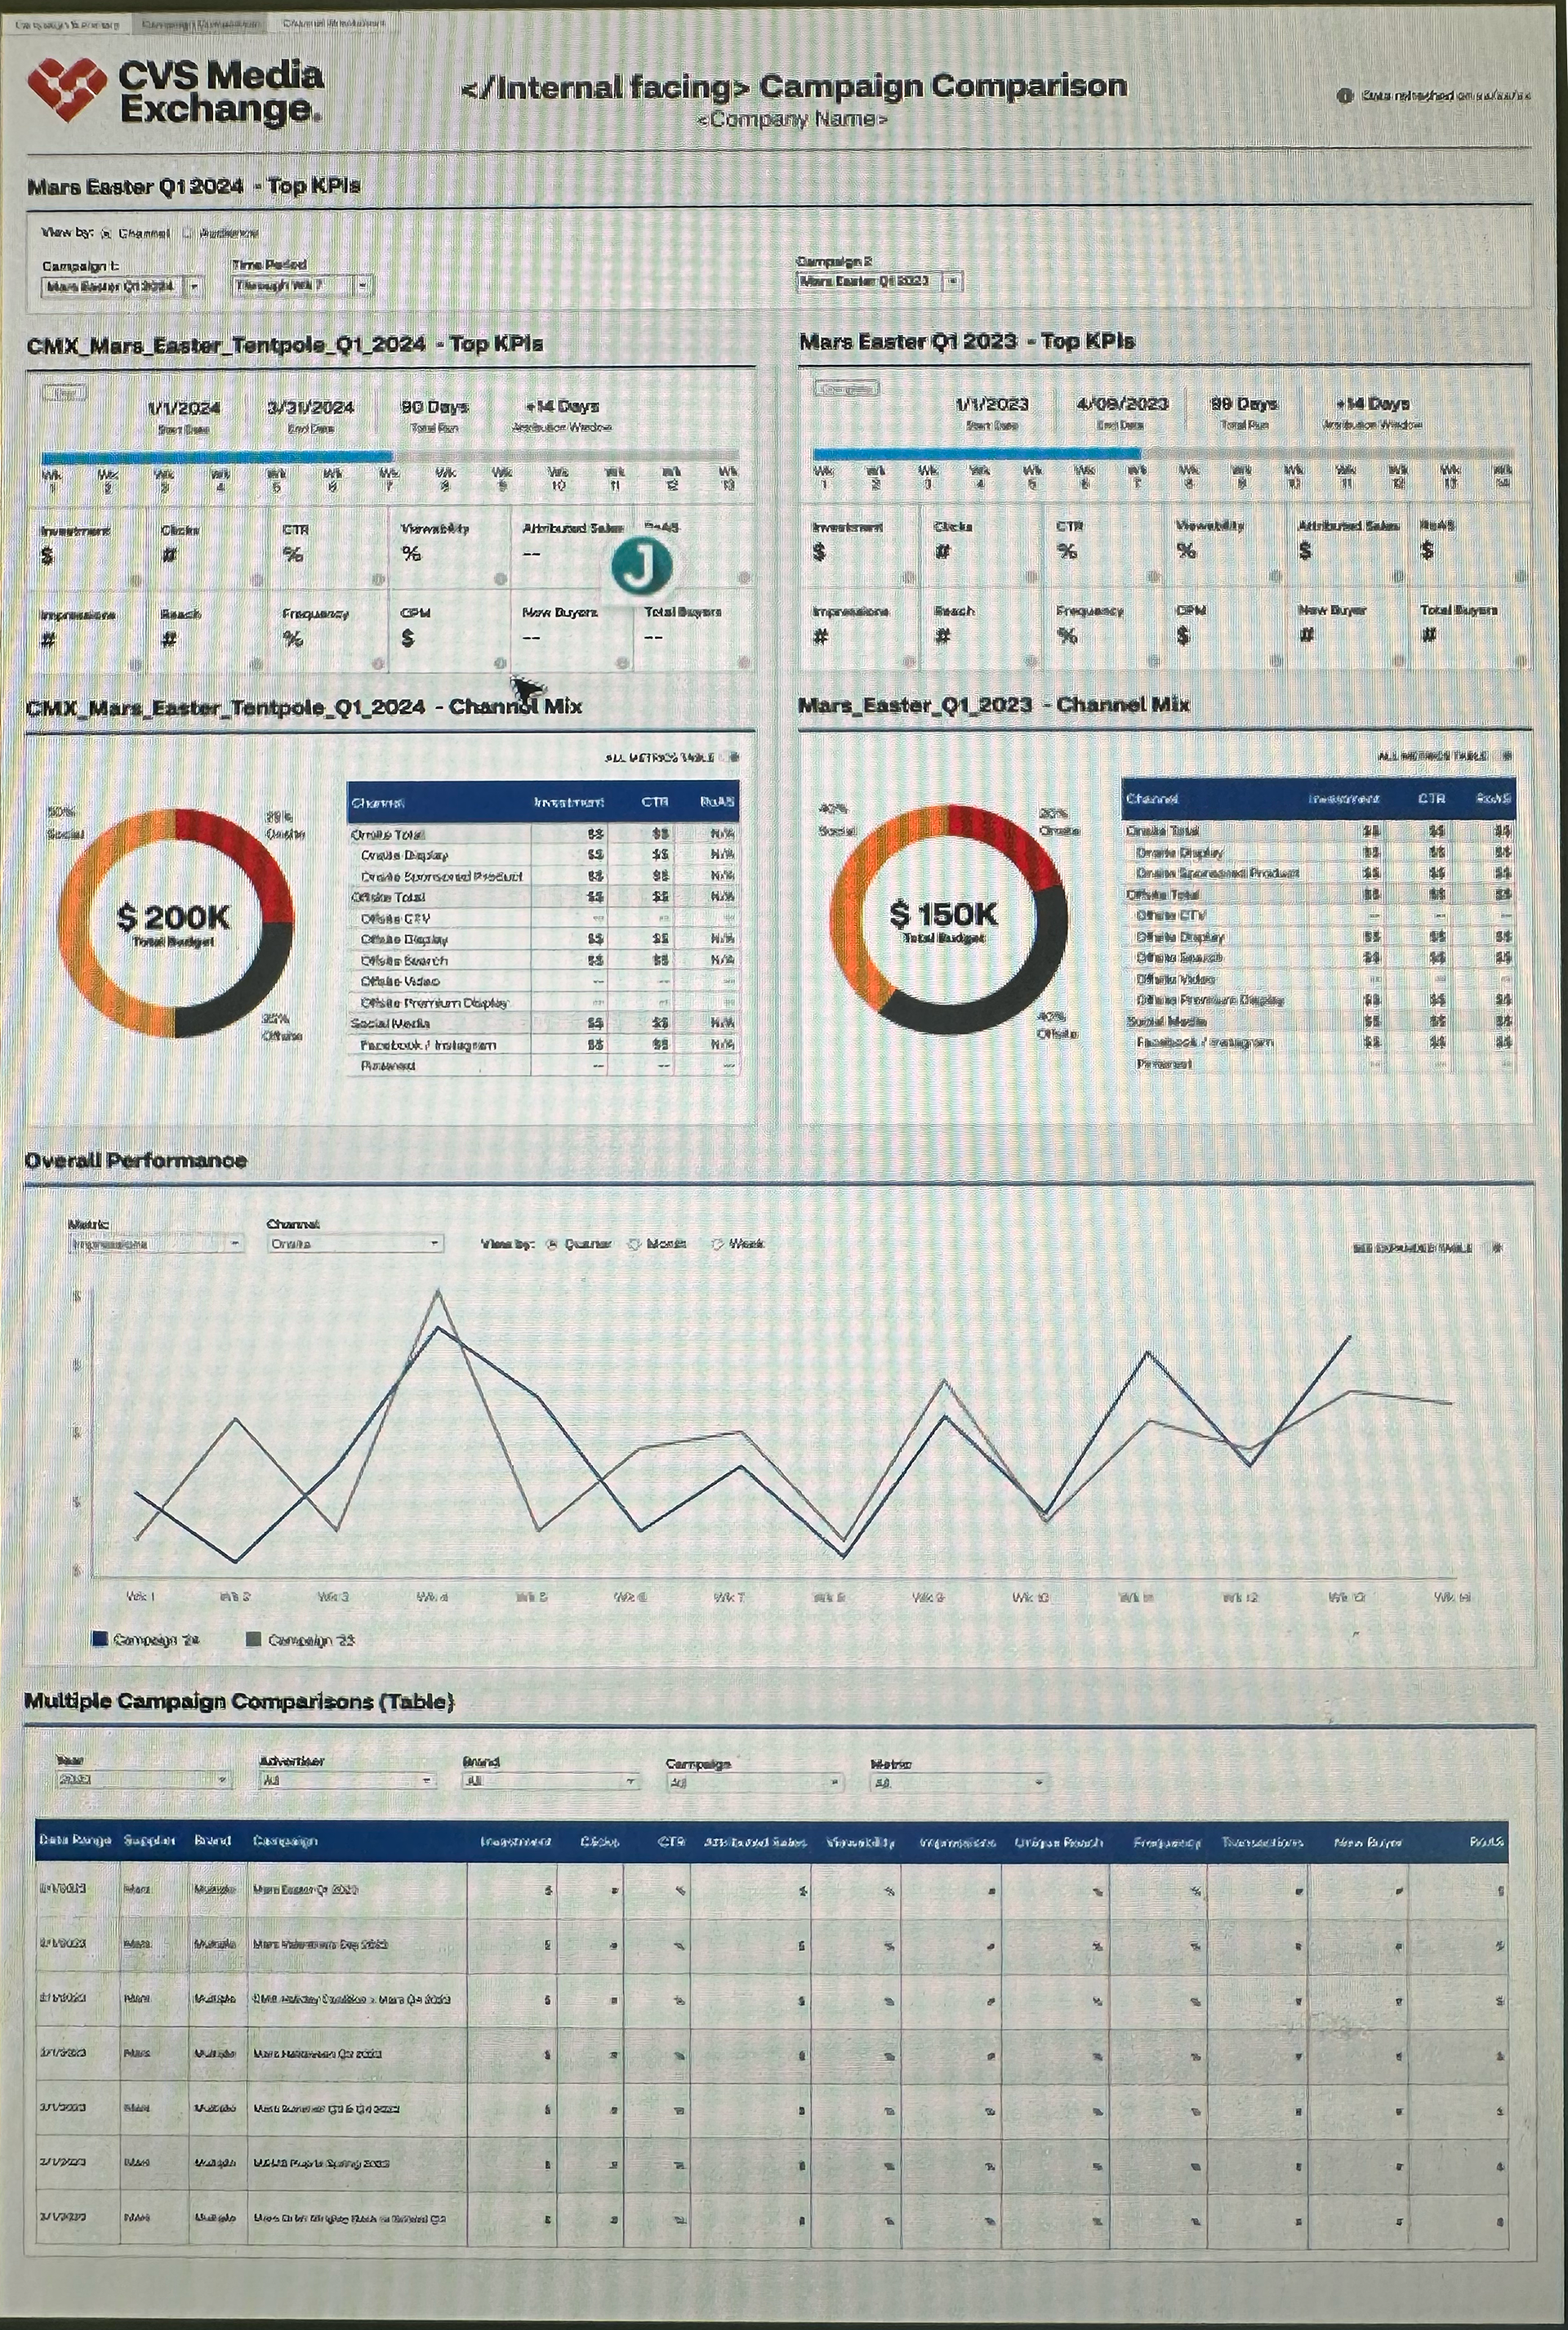
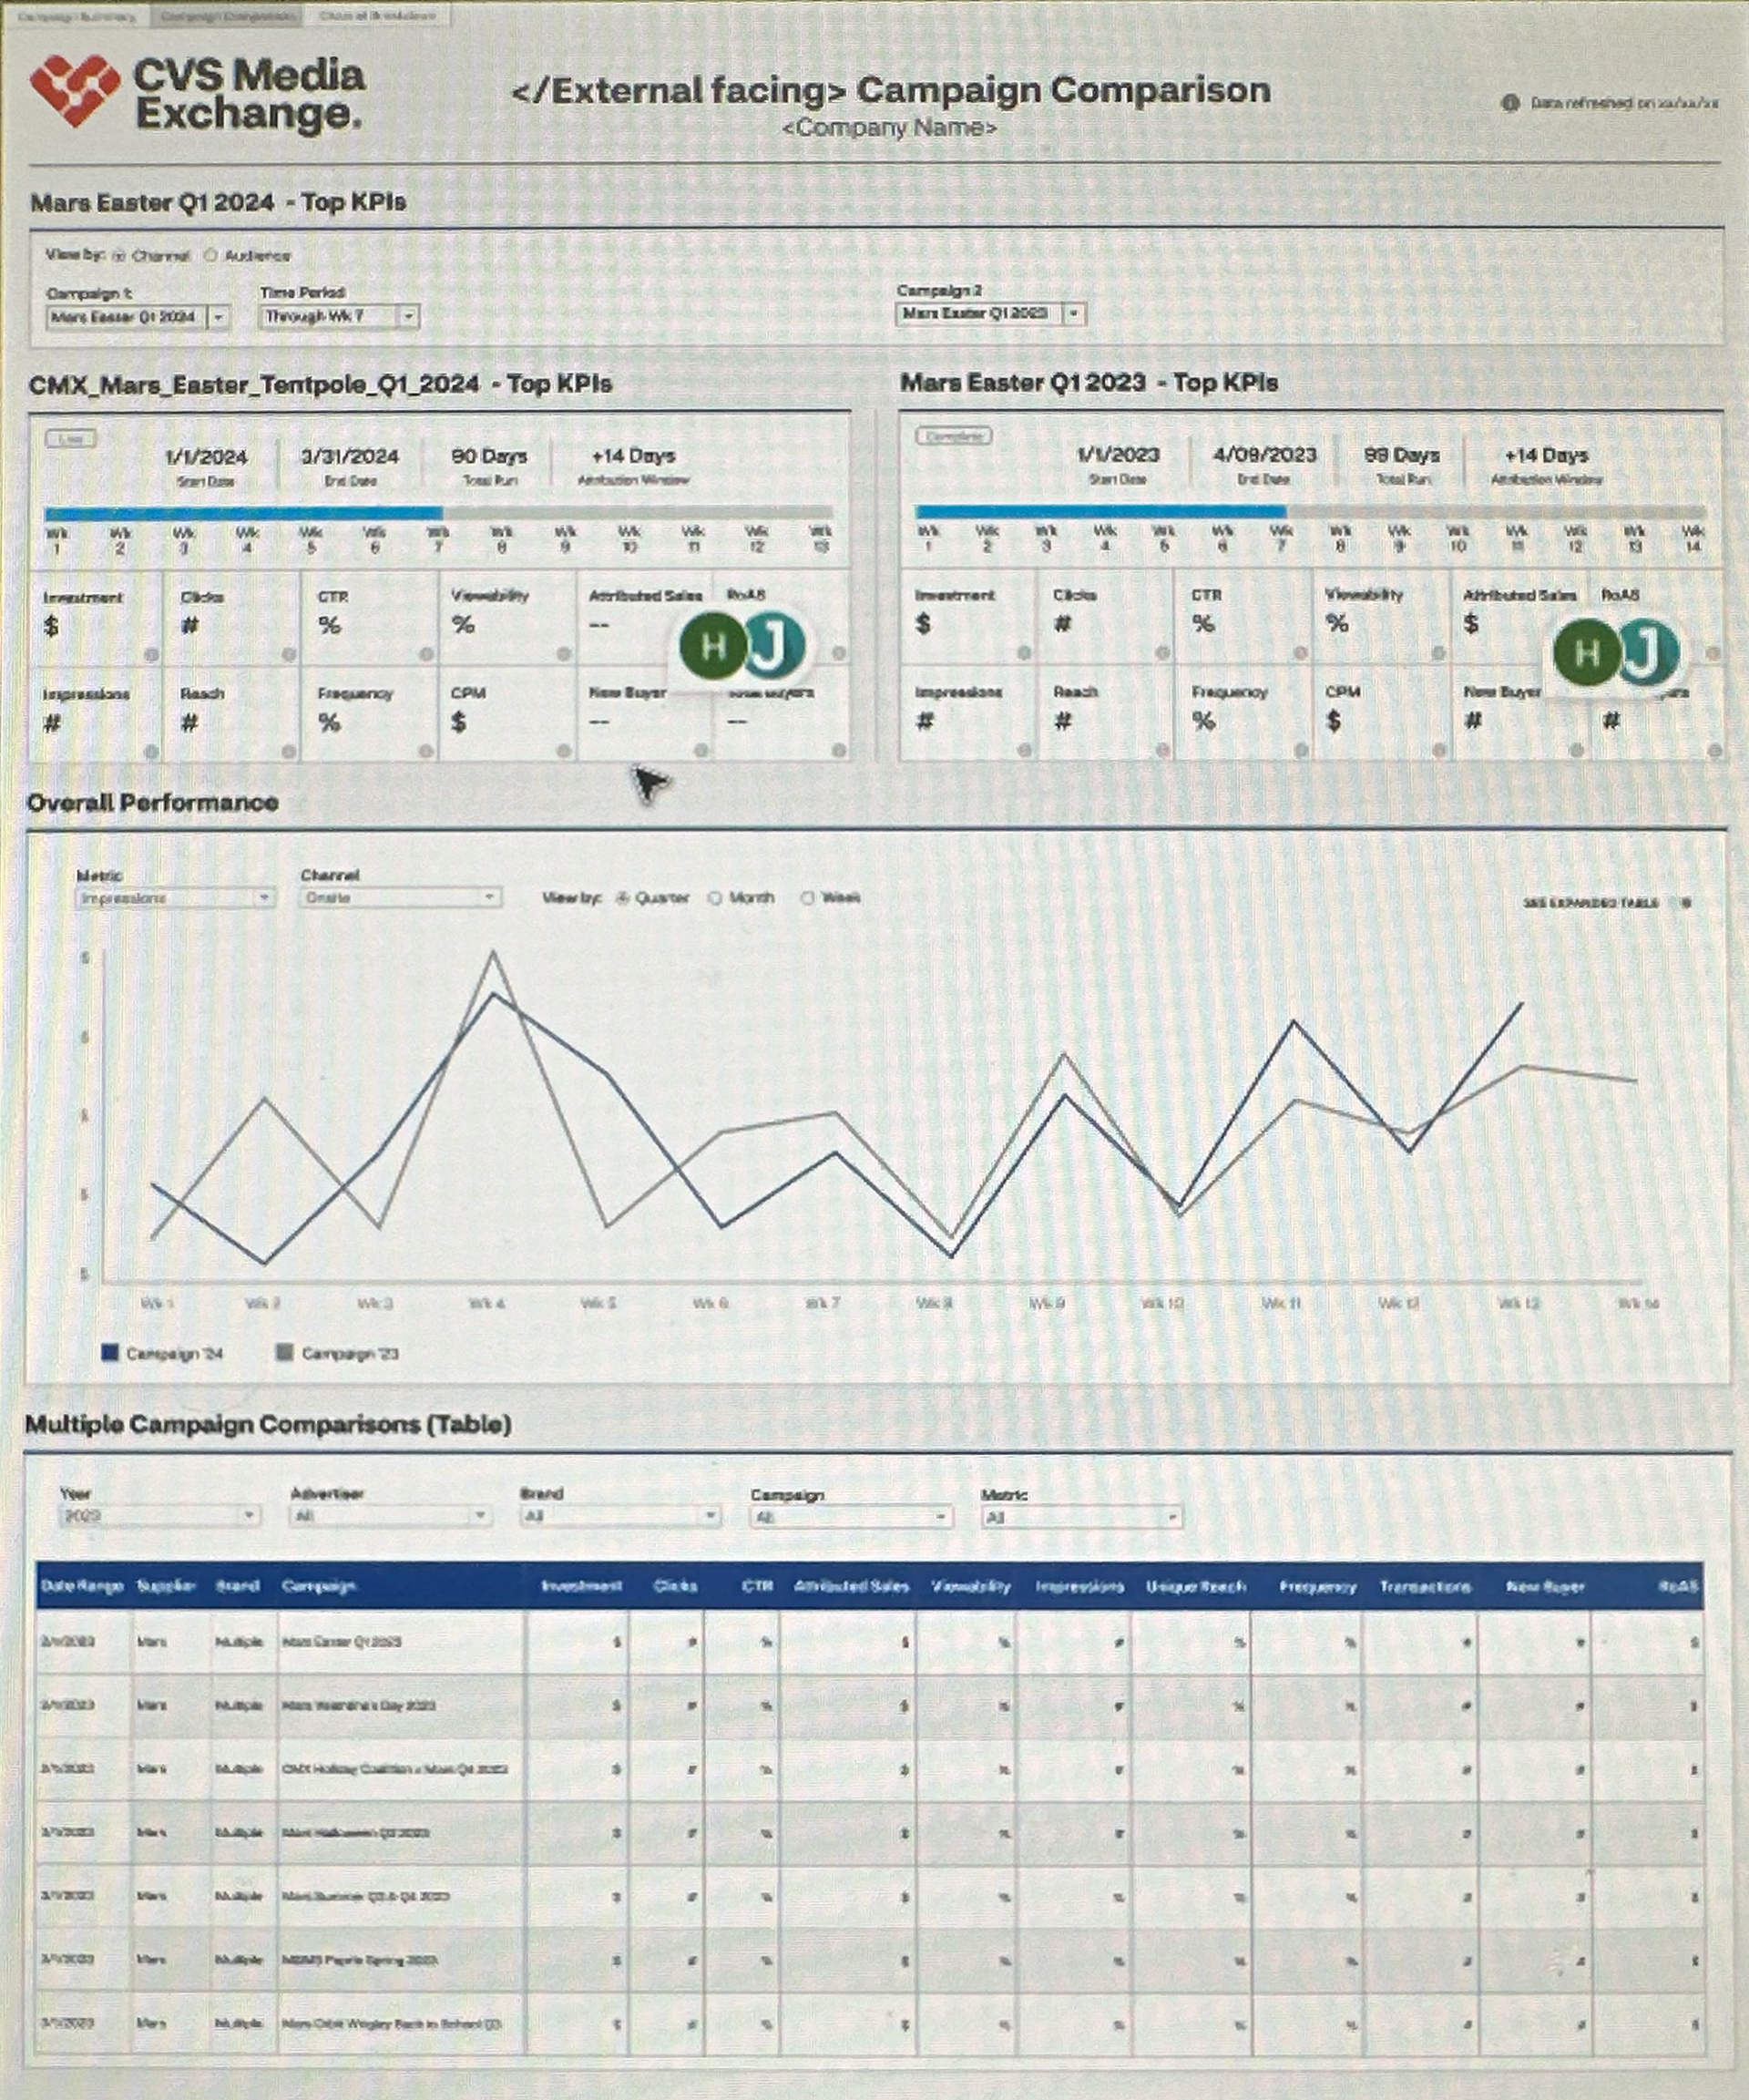
Product Release: The newly enhanced CMX Performance Dashboard launched 2 weeks ahead of schedule with on-demand insights including comprehensive engagement and sales metrics, allowing teams to track media delivery and provide greater transparency. Access to daily performance metrics with the ability to view KPIs across selected campaigns and assess trends by channel, audience, and transaction type. Inform your optimization strategies with side-by-side campaign analysis and detailed, downloadable data tables.'
New Metrics in the final dashboard included:
• Media engagement metrics
• Reach
• Frequency
• New Buyers (NTB)
• Total Buyers
• Attributed sales by audience
• Attributed sales by transaction type
• Attributed sales for Pinterest
• Top 10 SKUs by attributed sales
• Media engagement metrics
• Reach
• Frequency
• New Buyers (NTB)
• Total Buyers
• Attributed sales by audience
• Attributed sales by transaction type
• Attributed sales for Pinterest
• Top 10 SKUs by attributed sales
Product Launch Results
The product launch increased external usage by 17% after the first quarter it was released and since then, CMX is tracking an explosion of growth in new business. In their own words...
"This year, The sales team--our primary stakeholders and users--are taking these dashboards to our largest clients. Multibillion corporations now have a clean intuitive dashboard to drive their campaigns and fine tune results. We've got nothing but great feedback (from sales) about how this has enabled so much interest and new business for them. The confidence that this platform brings to our sales pitches has been a game changer."
- James Friedman | Senior Manager, Business Intelligence & Measurement @ CMX